
In this first crypto point of the October Weekend, let’s see what has happened in recent days. Has the situation changed on the markets? For the moment, we must not forget that we are in an underlying downward trend, which does not make it easier to read the market when the macroeconomic context is tense. For example, a few days ago, the Bank of England was forced to buy government bonds to avoid the continuation of the soaring price of debt. Will other states cave in and do the same? What is certain is that the economic problems are far from behind us. This could harm the assets for several more months risk-on such as cryptocurrencies.
This market analysis is brought to you in collaboration with CryptoTrader™ and its algorithmic trading solution finally accessible to individuals.
Cryptocurrency capitalization is still under resistance
Since last week, the situation has unfortunately changed little on the market. Cryptocurrencies continue to sideways, showing very little momentum. However, vis-à-vis certain announcements such as that of the Bank of England, the markets are led to temporarily overreact. What is interesting to note is that last week’s goal has been reached with a bearish rejection at the resistance at $943B. For the moment, the market still can’t recover this zone, nor even the 919 billion with a simple bullish close.
Thus, we can see a contraction in the price since the second half of September. It is certain that a new movement is approaching, but which direction could it take? For the moment, the market is in a new daily range between 943 billion and 856 billion. As long as one of the levels is not broken, the price will continue to move inside.
To start again on a rebound of a few weeks, it will not be a simple task since, in addition to the resumption of the 943 billion dollars, the MA 100 is located at 970 billion, it is the level to be resumed. If the market succeeds, it will be able to return without difficulty to 1000 billion. However, for now, the preferred bias is bearish. If the lower gray zone is broken down and the market is unable to overcome the resistances previously mentioned, cryptocurrencies will probably attack a new low point.
Altcoins are still in bad shape
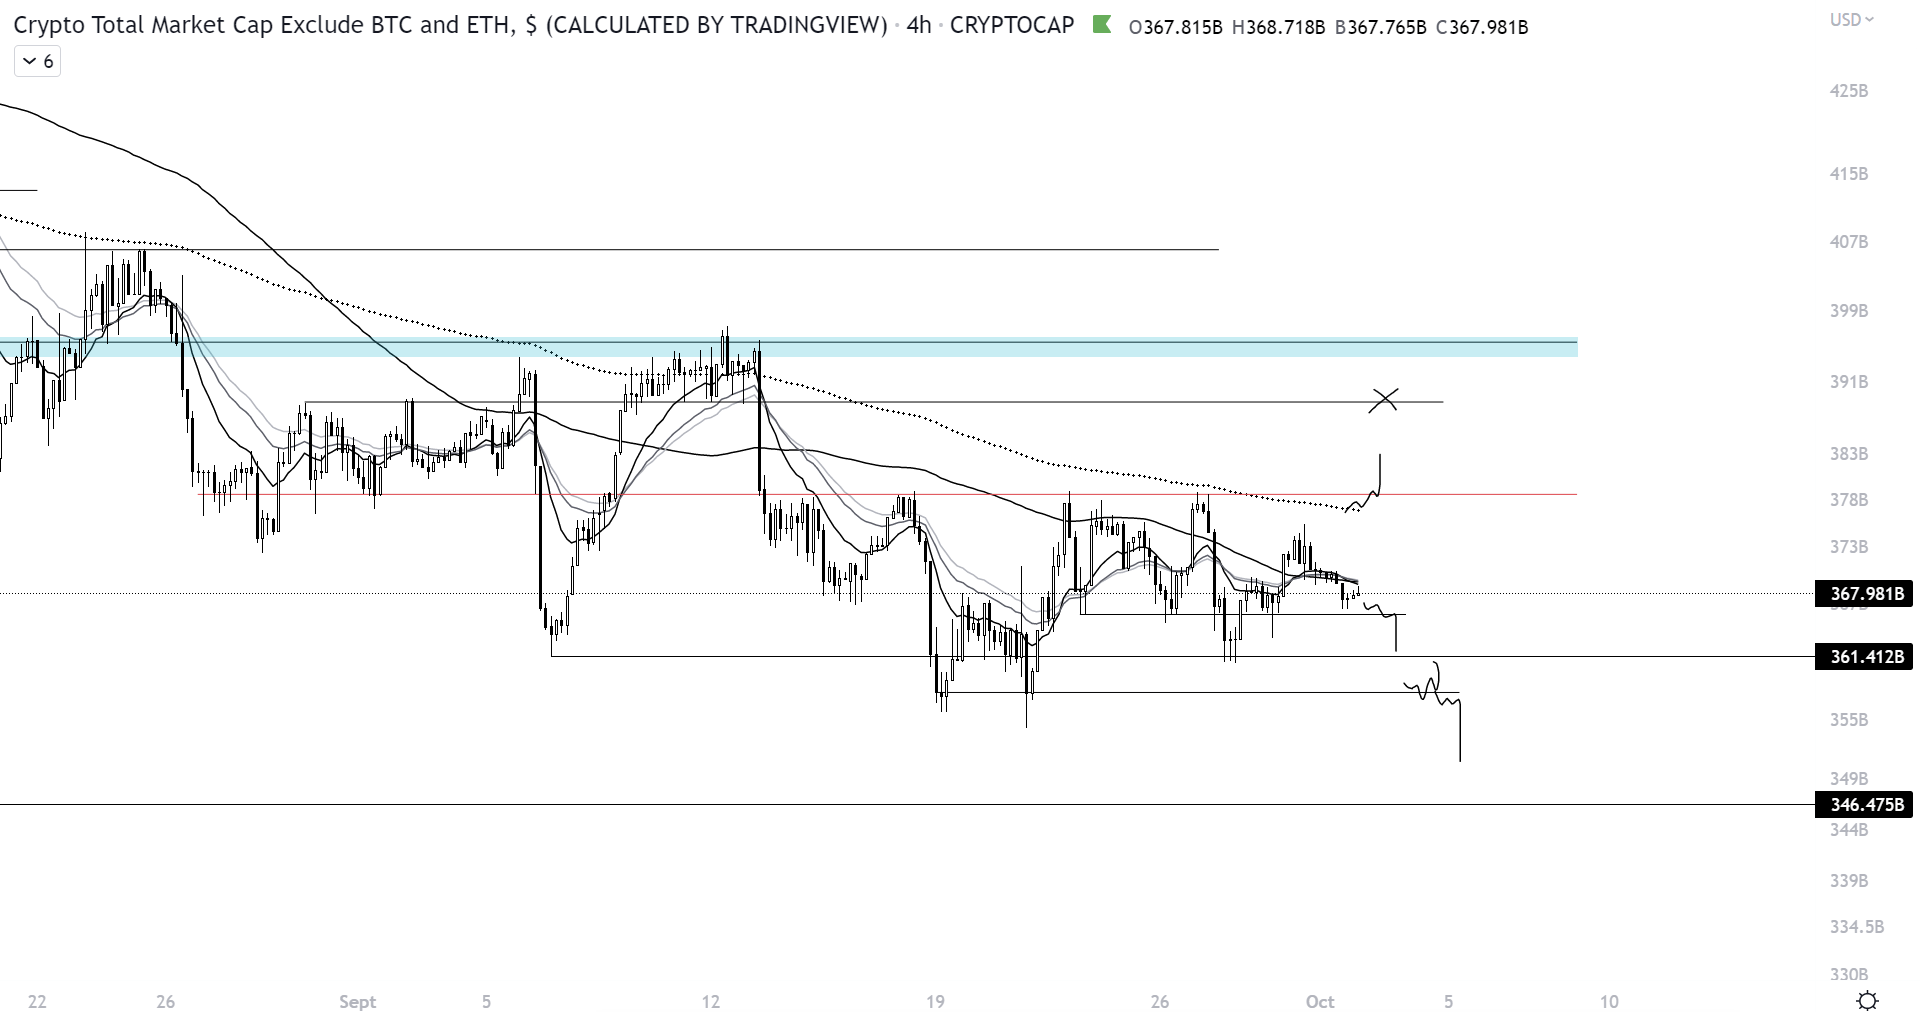
You can see that the market did not give the bullish scenario of last week. On the contrary, he favored the decline within the range. The altcoins made a bearish rejection on the resistance at 378 billion, especially since the latter was in confluence with the EMA 200, a very interesting moving center to determine a potential reversal of structure. Currently, the issue is simple for cryptocurrencies:
- Resume the resistance represented in red while remaining above the EMA200. If they get there, they can probably bounce back towards $388 billion. The target set last week has still not changed for the bullish scenario.
However, if it fails and the altcoins fail to recover the MA100 they are below, a loss of $365 billion could trigger a bearish scenario. For the moment, nothing is to report as long as a bullish or bearish breakout has not taken place. Note that currently, reading the market may be more complex when we are in an environment where the course is contracting.
October will probably be a decisive month for Bitcoin
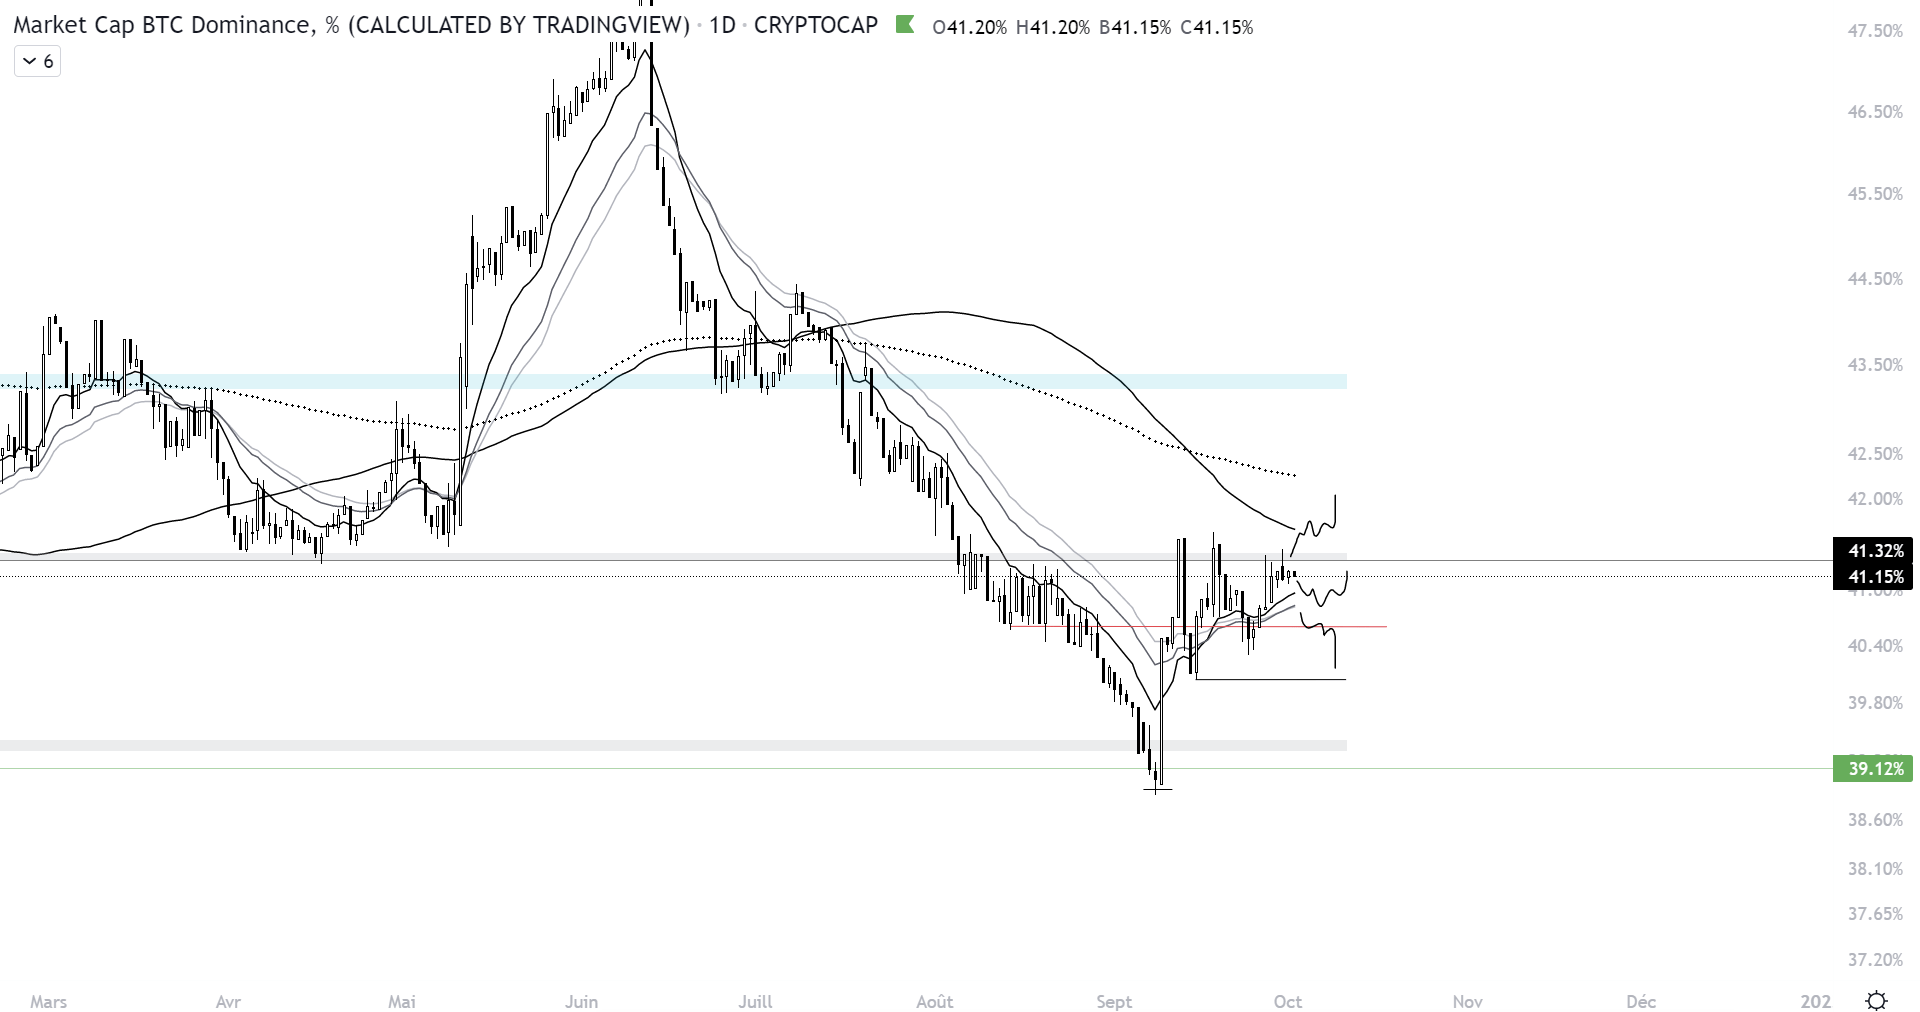
We can notice that the dominance of Bitcoin is still evolving below the 41.32% zone. Formerly support, this one is resistance. Could Bitcoin regain this level and continue to gain strength in the cryptocurrency market? If it succeeds and takes over the MA 100 located just above, it could push up to the daily 200 EMA (black dotted line). However, if it does not succeed, two scenarios can occur to us:
- The first is a continuity of the dominance range below 41.32% until Bitcoin manages to overcome it (or not). In this context, a favorable environment could register on the altcoins if Ethereum was able to start rising again.
- The second scenario would be an acceptance of the price below the short-term trend (MA13/25/32) while registering a new low below 40.60%. This could undermine Bitcoin’s strength within the market, eventually taking it to 40% dominance.
So keep watching for dominance, it’s essential. It will allow you to determine whether the market is more favorable to hedging via Bitcoin or to exposing yourself to altcoins.
What is the balance of power between Bitcoin and Ethereum today?
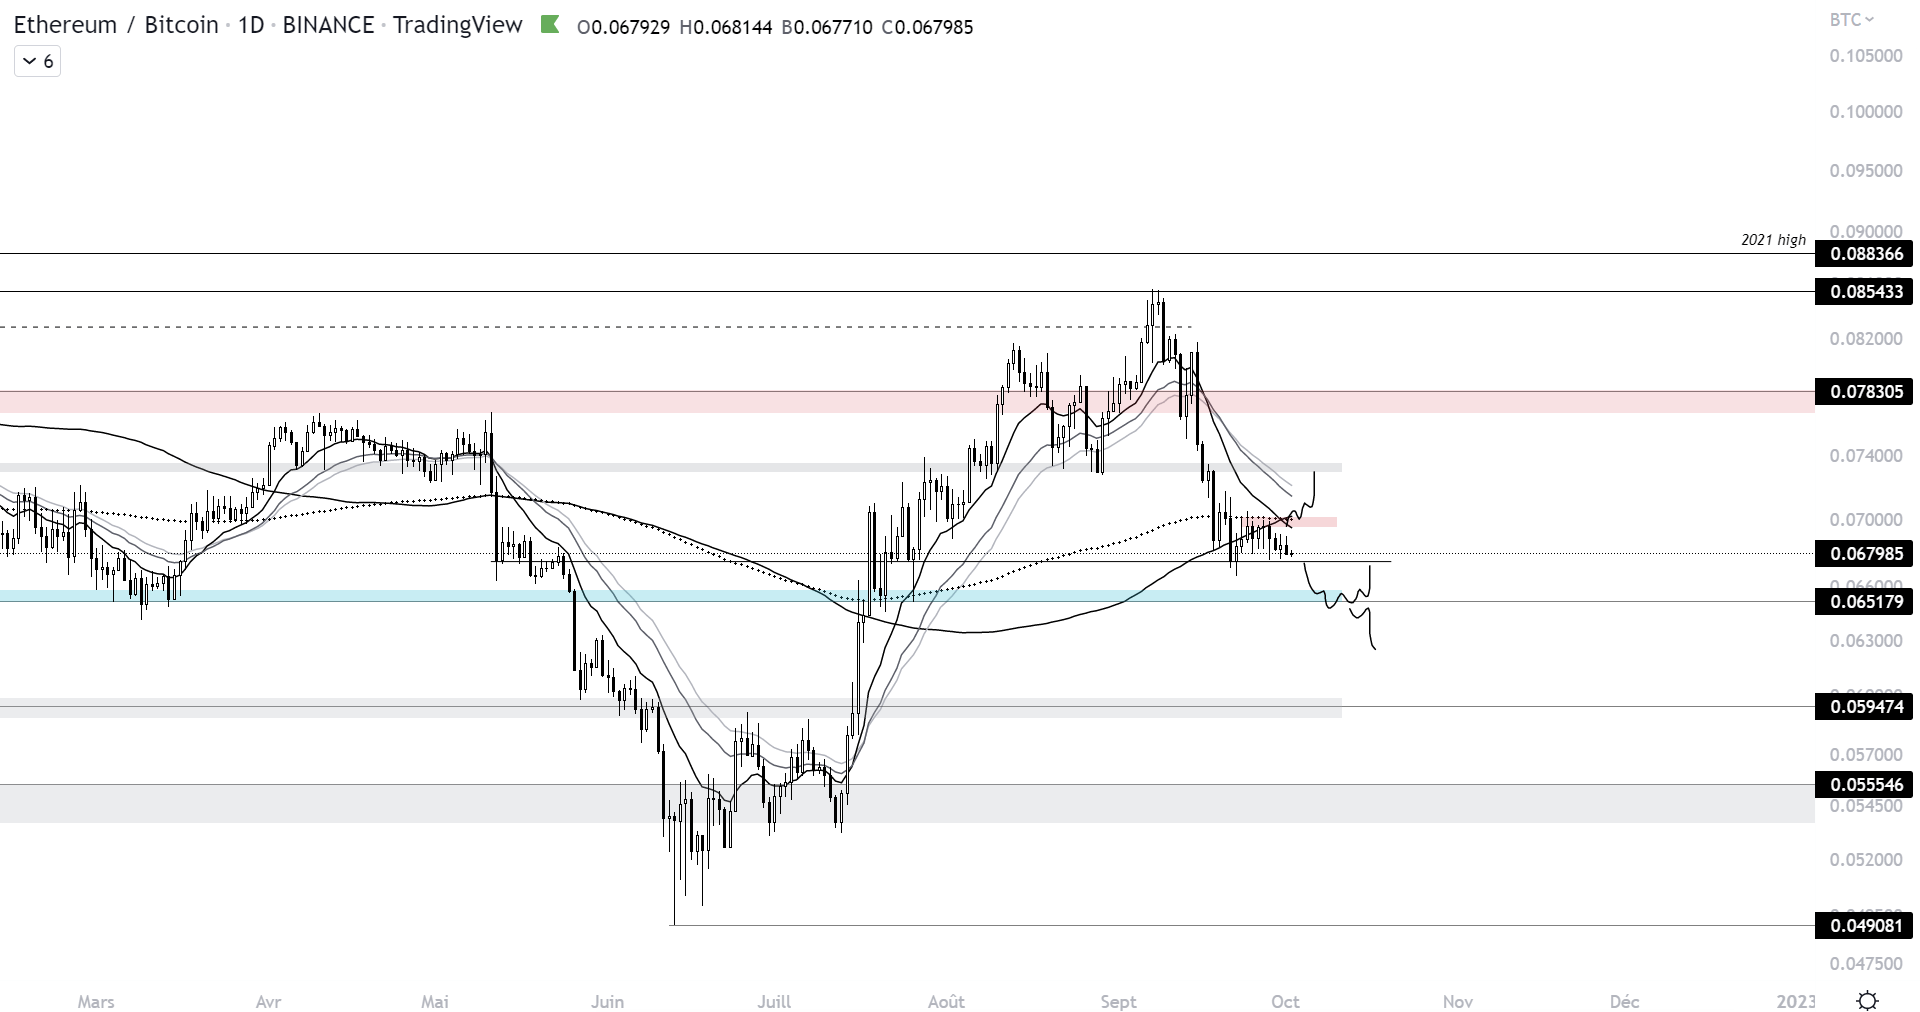
For the time being, the price seems to follow the bearish scenario that we discussed last week. Ethereum is not able, for the moment, to resume an important technical confluence which is the EMA 200 and the MA 100. The last time this configuration took place was in May. If the same thing happens, Ethereum could be hurt by taking altcoins down with it. So, what should be considered for the moment?
- If you have a rather bullish bias, do not expect anything incredible until the MA 100 and the EMA 200 are not regained. Moreover, we can see the formation of a local resistance at 0.07 BTC. If Ethereum manages to overcome it, it will be able to push to the upper technical zone (represented in gray).
- If you prefer the bearish bias, which is the case for this analysis of ETH/BTC, you will have to monitor the reaction of the price over the next few days. A loss of local support at 0.0674 BTC could cause the pair to return to the blue pivot zone below. The sequel would be important. If Ethereum does not manage to rebound, it will be necessary to consider a continuation of the fall with a bearish breakout.
The ALT-PERP index, a relevant tool for exposure to cryptocurrencies
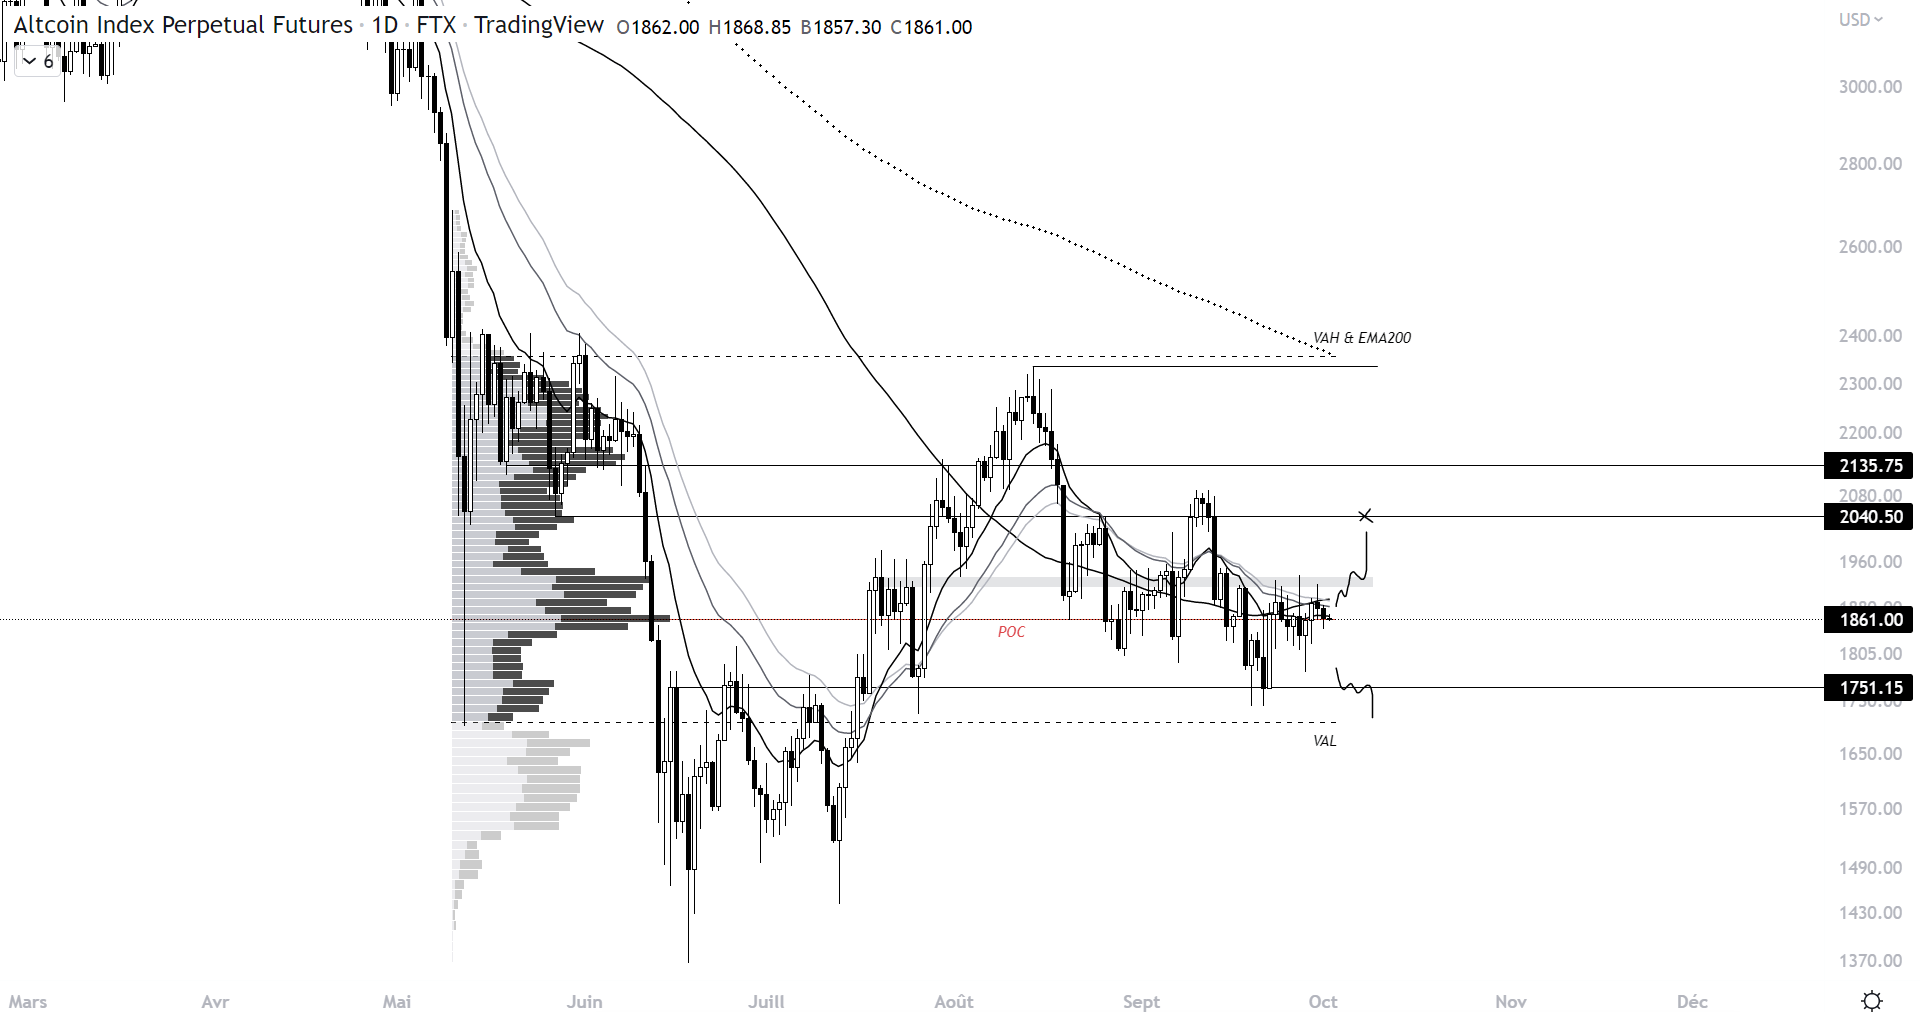
To complete the analysis, let’s look at an index available on FTX. This allows you to expose yourself to all altcoins. This is interesting in the event that, if you thought a rebound would take place, you could be exposed to a basket of assets rather than a single cryptocurrency that could underperform the market. In this case, using the Volume Profile, we can determine different levels to watch for altcoins.
The major level is the POC, it is the level where the volume traded is the most important. It tends to be support or resistance on different timeframes. Moreover, you can see the contraction of the index between this level and a resistance zone just above. If the index manages to get rid of it as it is annotated on the graph, a nice bullish push could take place in the direction of 2040 billion dollars. This would be explained by an LVN (Low Volume Node), a price zone where the volume traded being low, the price movements that occur there are greater.
However, if there is an acceptance of the price below the POC, it will be necessary to watch the 1751 dollars. If this level drops, a drop will undoubtedly occur towards the Value Area Low at $1697. This could trigger a new bearish run that would hurt altcoins. Of course, this will depend on the course of Bitcoin and Ethereum.
Here we are at the end of this market point for cryptocurrencies. It is true that currently, there is nothing incredible to evoke. We are in a range which aims to tire the less seasoned players who could burn their wings with leverage trading. Pay attention to a bullish or bearish exit which could give a new trend to the market. Moreover, on October 13 we will have the one-year inflation figures for the month of September. It is very likely that the market will not do anything exceptional until then. Finally, it is essential to monitor the balance of power between Ethereum and Bitcoin as well as the dominance of the latter. They are very important indicators as to the turnover of capital and the trends that may emerge within this market itself.
Is it possible to be a winner every time? Whether the price of Bitcoin is in great shape, or going through turbulence, CryptoTrader™ allows you to increase your chances of success through its 100% automated algorithmic trading tool.


