
For this new week in the financial markets, let’s analyze FTTthe token of the exchange platform FTX. Is he in a good situation right now? Although the assets of exchanges can hold up relatively well against Bitcoin (BTC), they are not spared from the bear market. Today, let’s head to TradingView to determine the key levels to watch and the bias we may have over the next few weeks.
This market analysis is brought to you in collaboration with CryptoTrader™ and its algorithmic trading solution finally accessible to individuals.
An unfortunately downward trend on important time frames
While the FTT was doing very well at the start of 2022, it unfortunately stalled in April. For now, it is holding above support at $22.75/$23.25. The asset is moving between this support and a resistance at $32.66 on which it has been repeatedly rejected. Within this range, two levels are to be watched on the 3D time scale:
- The horizontal level at $29.15, a real pivot on which the FTT confirmed a bearish pullback two weeks ago.
- The gray area just above the current price, it is located at 25/25.3 dollars. Local support at the end of August as well as the beginning of September, we can envisage a rejection of the price on this level in the event of a rebound.
For the moment, the bias to have is bearish. We are currently witnessing the formation of lows and descending highs, which demonstrates the strong selling momentum. For the moment, as long as the price of FTT is not led to operate a reversal of structure with a close above 29.15 dollars, we must preserve the current bias. Thus, within the next few weeks, the chances of revisiting the June low at $21.03 are more significant. We are now going to move to a time scale lower than the one we have just studied.
A bullish correction coming in the next few days?
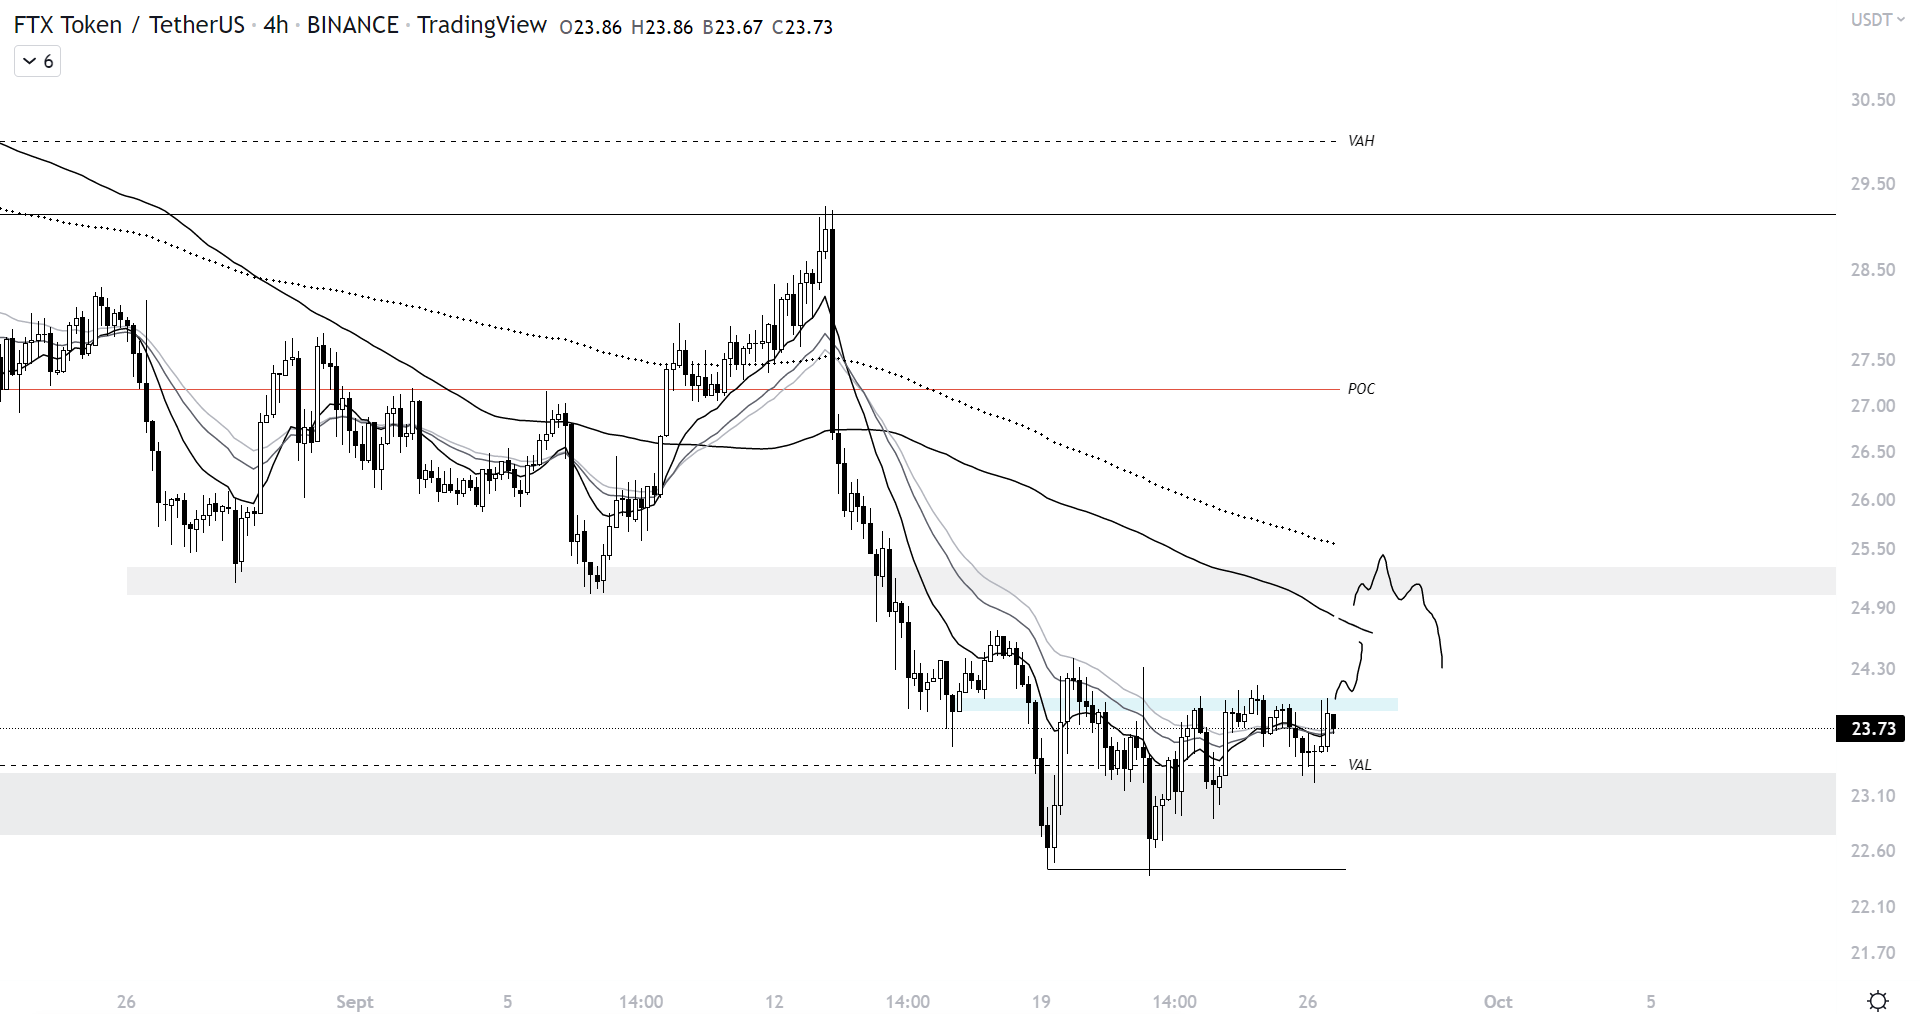
Although we have a bearish bias on a larger timeframe, there is no point in ruling out an upside on smaller timeframes if the technical patterns suggest that. Notice that since September 19, FTT has been trading below resistance at $23.90/$24 while swinging up and down with the set EMA13/15/32. The price is compressing, so expect volatility to return very soon. If FTT manages to hold its EMA and close in H4 above the resistance, we can expect a few bullish candles.
The targets are on the MA100 at $24.65 and the EMA200 at $25.54. The latter is getting closer and closer to the old local support, which makes it a technical area that should not be overlooked. It will be necessary to monitor the asset on small time scales since as long as it does not break free from this zone, nothing will be reported. All the more, if FTT returns below its VAL and registers troughs and descending peaks, it will then be preferable to consider a return of the price to the recent troughs.
FTT and Bitcoin, shock duel?

Against Bitcoin, notice that the price action is very interesting with the price moving within a range since June. The upper limit is at 13313 satoshis and the lower limit at 12231 satoshis. A bullish deviation having taken place above the upper limit, is it the same case with the lower limit? If so, FTT would need to break higher from its previous high in order to outperform against Bitcoin. However, it is important to note the recent loss of EMAs for FTT, a first for several months! If he can’t get rid of it and he rejects it, expect the asset to underperform against Bitcoin in the coming months…
Here we are at the end of FTT’s technical analysis. Note that the latter is in a difficult position against the dollar since it is in a downtrend. However, nothing is decided yet. We can expect a bullish move from the asset ahead if it manages to break out of the $24. Currently, this is the level to watch. Of course, remember that FTT is not in its best shape against the king of cryptocurrencies. If the downtrend is indeed present, FTT could unscrew sharply downwards with investor appetite for Bitcoin. It’s kind of double or nothing on this pair, it’s now or never that the FTT must demonstrate a situation of strength.
Is it possible to be a winner every time? Whether the price of Bitcoin is in great shape, or going through turbulence, CryptoTrader™ allows you to increase your chances of success through its 100% automated algorithmic trading tool.

